 SPX: Long-term trend – Bull Market
Intermediate trend – While everything technical points to an overbought condition which should require an adjustment, the exact timing of that correction is for the market itself to decide and reveal.
Analysis of the short-term trend is done on a daily basis with the help of hourly charts. It is an important adjunct to the analysis of daily and weekly charts which discusses the course of longer market trends.
TECHNICAL INDICATORS WORSENING
Market Overview
Last week, the SPX traded in a very small range. That had the effect of creating even more deceleration than occurred two weeks ago. At that time, the waning uptrend was rescued by the announcement that the Bank of China had cut its lending rate. This caused the index to gap open, and move to a new high, but the rally quickly ran out of steam and prices went essentially sideways for most of the week.
There was another announcement which impacted the market on Thursday! OPEC left its production rate unchanged. While this was clearly a negative for oil stocks, the rest of equities were not sure and the index quickly stabilized near unchanged, but sold off at the close. Since Friday was a short session, the week-end may be required to fully digest the impact of this decision and, by Monday, we will know better how the overall market is taking the news, although the longer-term effects are likely to be negative.
Let’s look over the week’s impact on the technical indicators.
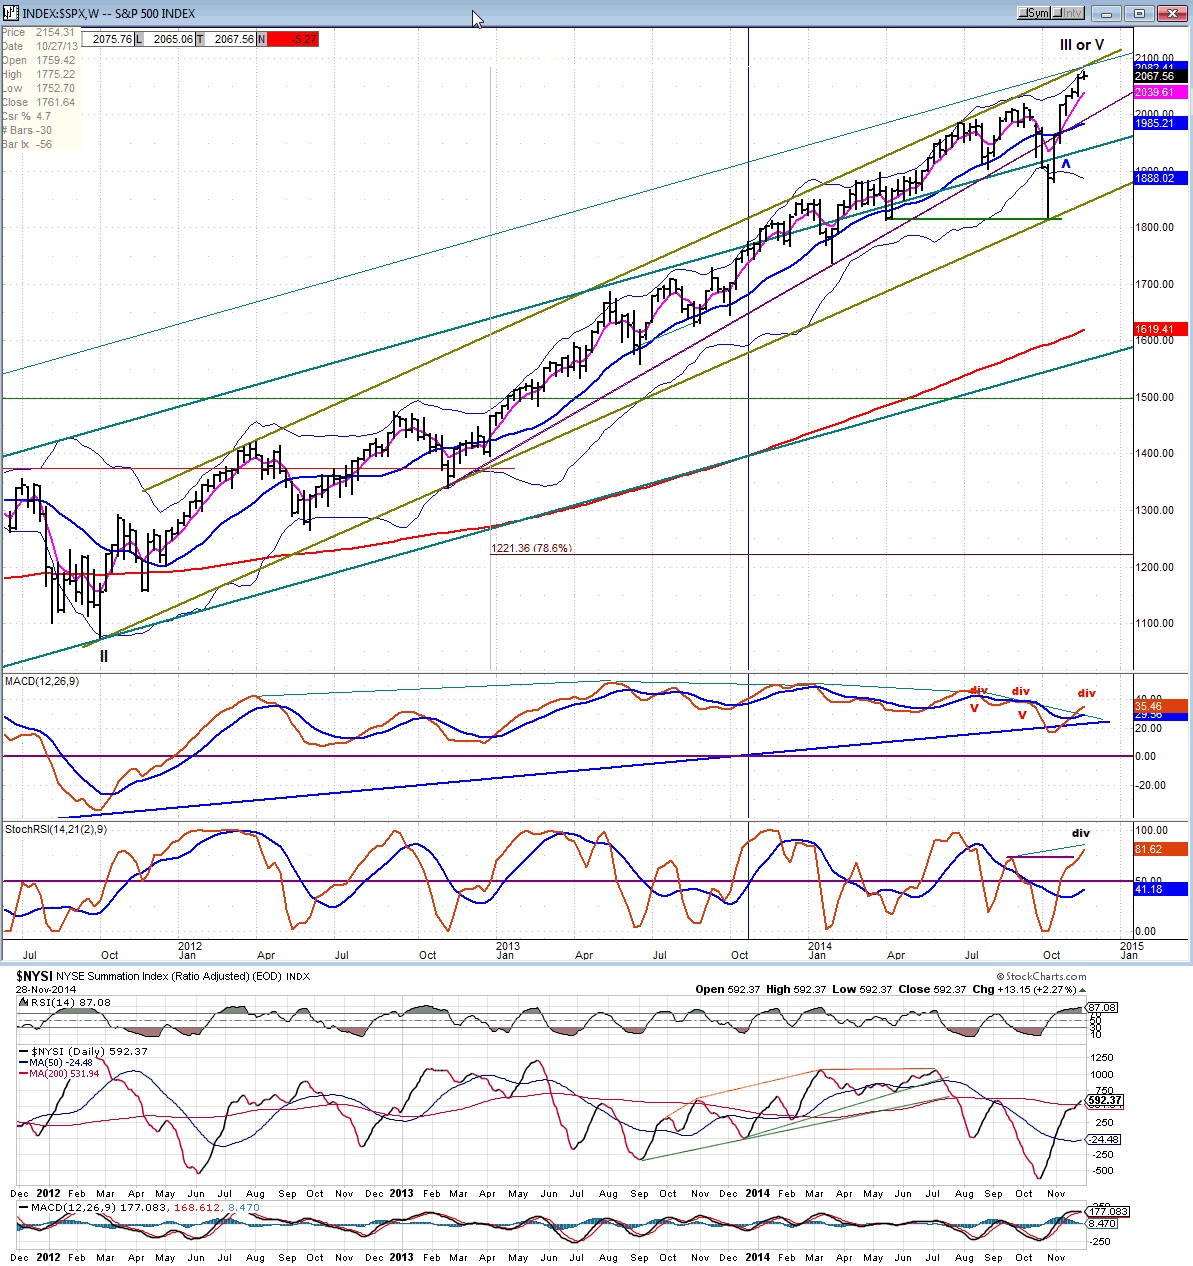
Momentum: The weekly MACD continued to edge up with severe negative divergence. The SRSI is, at best, neutral with a strong negative bias. With its histogram at .46 the daily MACD is very close to making a bearish cross, while the SRSI has (finally) begun to roll over. The hourly MACD is still positive but has started to accelerate its decline.
Breadth: The McClellan Oscillator rolled over after posting strong negative divergence. The Summation Index pushed slightly higher.
Structure: Probably still in primary wave 3. It remains within the confines of its intermediate channel.
Accumulation/distribution. Short-term: A small distribution pattern has formed on the 1X P&F chart. Long-term: No sign of distribution on 3X chart.
XIV: Has played catch-up with SPX in the past few days and may have filled a projection. It sold off sharply on Friday.
Cycles: It may be time to consider the implications of the 7-year cycle topping in this time frame with a low towards the end of 2015.
This post was published at Gold-Eagle on November 30, 2014.

 Follow on Twitter
Recent Comments